Frequency Series
The FrequencySeries object is designed to represent frequency domain datasets, such as fast Fourier transform (FFT) and power spectral density (PSD). Therefore, this page will be helpful to represent them by matplotlib.
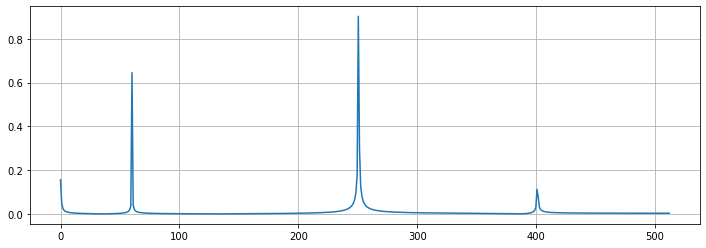
Single channe data plot
>>> from mcgpy.timeseries import TimeSeries
>>> import numpy as np
>>> t = np.linspace(0,1,1024)
>>> source = 0.3*np.sin(400*2*np.pi*t) + 1.3*np.sin(60*2*np.pi*t) + 2*np.sin(500*np.pi*t) + np.sin(0.1*np.pi*t)
>>> data = TimeSeries(source, t0=0, sample_rate=1024)
>>> fs = data.fft()
>>> from matplotlib import pyplot as plt
>>> fig, ax = plt.subplots(1, figsize=(12, 4))
>>> ax.plot(fs.frequencies.value, fs)
>>> ax.grid(True)
>>> plt.show()
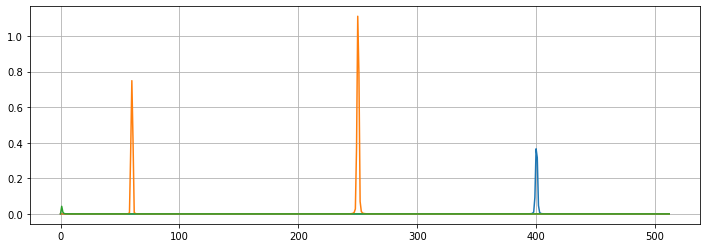
Multi channel dataset plot
>>> from mcgpy.timeseries import TimeSeriesArray
>>> import numpy as np
>>> t = np.linspace(0,1,1024)
>>> source = [0.7*np.sin(400*2*np.pi*t),
              1.3*np.sin(60*2*np.pi*t) + 2*np.sin(500*np.pi*t),
              np.sin(0.1*np.pi*t)]
>>> positions = np.random.random((3,3))
>>> directions = np.vander(np.linspace(0,0,3),3)
>>> dataset = TimeSeriesArray(source=source, positions=positions, directions=directions, t0=0, sample_rate=1024)
>>> fss = dataset.asd(1,0.5)
>>> fig, ax = plt.subplots(1, figsize=(12, 4))
>>> ax.plot(fss.frequencies.value, fss.T)
>>> ax.grid(True)
>>> plt.show()