MCGpy
Description
The MCGpy package contains classes and utilities providing tools and methods for studying and analyzing magnetocardiography(MCG) dataset.
It is designed for someone who wants to utilize it for instrumental or medical purposes without knowing detailed algorithms. For this purpose, several key features of the MCGpy are based on the basic concept and ideas of the GWpy, developed by Duncan Macleod duncan.macleod@ligo.org.
The simple example
With this idea, MCGpy allows users to read and analyze data more efficiently and effectively. For exampe, any magnetocardiography time-series data from the raw file can be simply read:
from mcgpy.timeseries import TimeSeries
data = TimeSeries('~/sample/data/file.hdf5', number=1)
and signal processing:
datab = data.notch(60).bandpass(0.1,300).notch(120).crop(7955082122,7955082123)
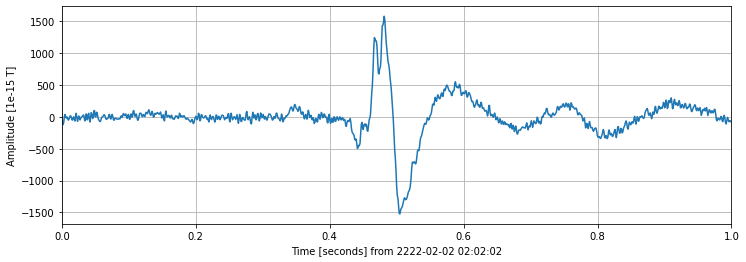
and visualization:
import matplotlib.pyplot as plt

fig, ax = plt.subplots(1, figsize=(12, 4))
ax.plot(datab.times.value, datab)
ax.set_xlim(datab.t0.value, datab.times[-1].value)
ax.set_ylabel('Amplitude [{}]'.format(datab.unit))
ax.set_xlabel('Time [seconds] from {}'.format(datab.datetime))
ax.grid(True)
plt.show()
